
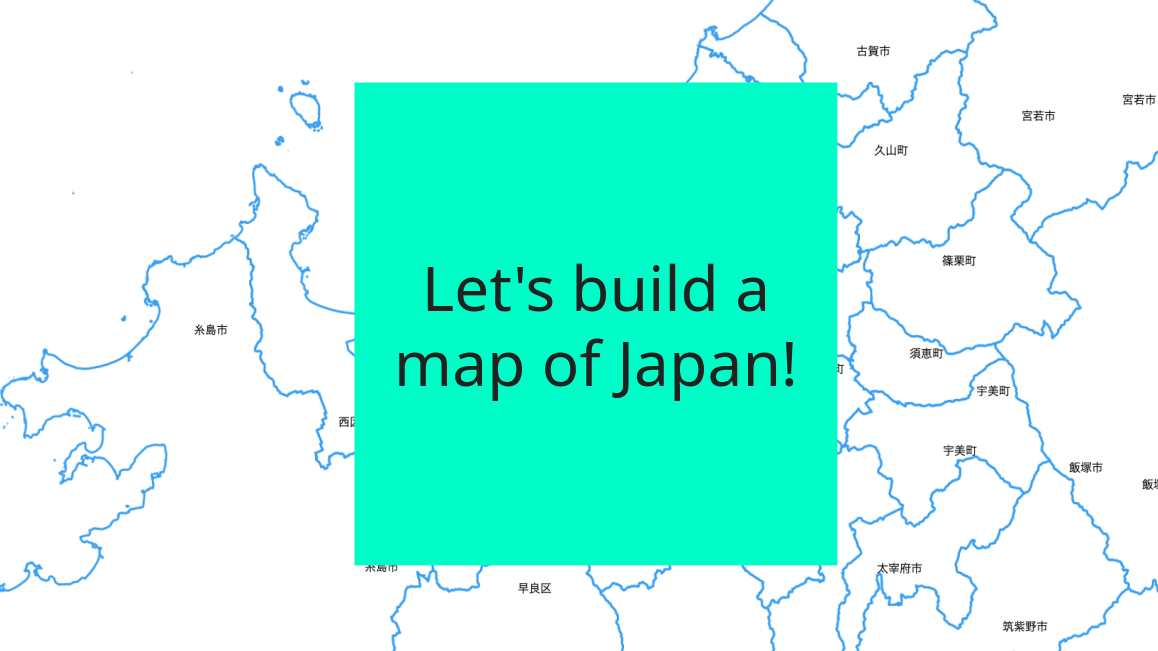
Vector map tiles in Rails
Info Notice: This article was initially published for Yamap’s sponsor session of Fukuoka RubyistKaigi 03.
First, what are vector tiles? Vector tiles are a format for efficiently transmitting and rendering spatial data in web maps. Unlike traditional raster tiles, which are pre-rendered images of the map, vector tiles contain raw geometries and feature data that the client can style and render dynamically.
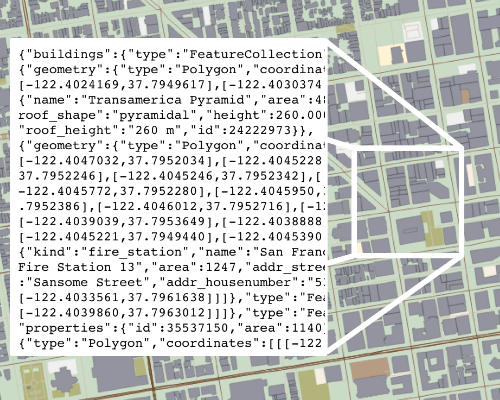
Image Source:tilezen.readthedocs.io
Let’s set up Rails with GIS support.
First, create a Rails application with a Postgres database. Then, update our Postgres instance to include the PostGIS plugin. We use PostGIS to store geometric data and generate vector tiles. The easiest way to get PostGIS up and running is with a Dockerfile.
FROM postgres:15.2

ENV POSTGIS_VERSION 3.3.2
ENV POSTGRES_HOST_AUTH_METHOD trust

RUN apt-get update \
      && apt-get install -y --no-install-recommends \
            libxml2-dev libproj-dev libgeos-dev libgdal-dev libkrb5-dev \
            wget cmake make g++ libboost-dev libcgal-dev libdata-dump-perl \
            protobuf-compiler protobuf-c-compiler libprotobuf-dev proj-bin \
            libprotobuf-c-dev libprotobuf-c1 postgresql-server-dev-$PG_MAJOR

RUN wget --no-check-certificate https://download.osgeo.org/postgis/source/postgis-$POSTGIS_VERSION.tar.gz \
      && tar xvzf postgis-$POSTGIS_VERSION.tar.gz \
      && cd postgis-$POSTGIS_VERSION \
      && ./configure \
      && make \
      && make install \
      && cd ../.. \
      && rm -Rf postgis-$PGROUTING_VERSION \
      && rm postgis-$POSTGIS_VERSION.tar.gz
We can start our PostGIS server with docker-compose.
version: '3'
services:
  db:
    build:
      context: ./docker/db/
    environment:
      POSTGRES_USER: demo
      POSTGRES_PASSWORD: demo
    ports:
      - "5432:5432"
    volumes:
      - postgresql_data:/var/lib/postgresql/data

volumes:
  postgresql_data:
To enable PostGIS in our Rails database we need to add a migration.
class CreateExtensionPostgis < ActiveRecord::Migration[7.0]
  def change
    enable_extension 'postgis'
  end
end
Unfortunately, Rails does not understand geometric data out of the box. The fantastic RGeo GEM can help with that. RGeo has a wrapper around ActiveRecord’s database connections to add geometry data support.
Please add the GEM to your Gemfile.
gem 'activerecord-postgis-adapter'
We need to register our new database connection in the database configuration.
default: &default
  adapter: postgis
Because we are running PostGIS in a docker container we need to add some connection information.
development:
  <<: *default
  database: geo_rails_demo_development
  host: localhost
  username: demo
  password: demo
You can see all changes here.
Data structure for geometric data
Let’s examine the data model for this example project. We want to save data on Japan’s municipalities in our database. For that, we need two tables: a parent table with the municipality’s name and child records to save the geometry data.
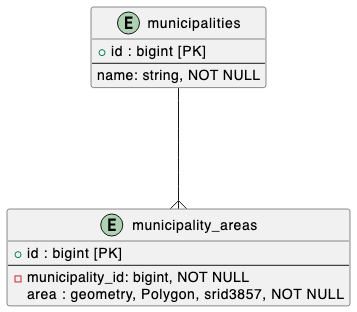
We have a has many relationships for the municipality_areas because islands and coastal features break up the municipalities in many areas.
# app/models/municipality.rb

class Municipality < ApplicationRecord
  has_many :municipality_areas, dependent: :destroy
end

# app/models/municipality_area.rb
class MunicipalityArea < ApplicationRecord
  belongs_to :municipality
end
The RGeo gem gives us some friendly migration helpers. We can create the PostGIS data types with the Rails migration DSL.
class CreateMunicipalities < ActiveRecord::Migration[7.0]
  def change
    create_table :municipalities do |t|
      t.string :name, null: false
    end

    create_table :municipality_areas do |t|
      t.references :municipality, null: false, foreign_key: true
      t.st_polygon :area, null: false, srid: 3857, index: { using: :gist }
    end
  end
end
We have created a PostGIS polygon type to hold our municipality areas. This type needs a map projection, srid 3857 Google Web Mecator. Map projections are mathematical models that project the round earth on a flat surface. Google invented the Web Mactor projection to show online world maps. The projection’s unique selling point is that it covers the earth in a square—a square that can be chopped up into individual squares (tiles) evenly.
You can see all changes here.
Import the geometry data.
The Japanese government provides GEO survey data for free. You can download the data here. The data is provided in the shape file standard. PostGIS comes with tools to import the shape file data into our data model. I don’t want to go into too much detail about his processing in this article. I create a script that downloads and imports the data.
But first we need to make a change to our docker-compose.yml to mount a folder for importing our data.
    volumes:
      - postgresql_data:/var/lib/postgresql/data
      - ./municipalities:/municipalities # import directoriy
With that set and the PostGIS server restarted we can execute the script to import the data.
#!/bin/bash

set -e

curl https://nlftp.mlit.go.jp/ksj/gml/data/N03/N03-2019/N03-190101_GML.zip --output municipalities.zip

unzip -d municipalities municipalities.zip

docker-compose run db shp2pgsql -I -s 4326:3857 municipalities/N03-19_190101.shp area_data > area_data.sql

bin/rails db < area_data.sql

rm municipalities.zip area_data.sql
rm -Rf municipalities/

echo "INSERT INTO municipalities (name) \
      SELECT DISTINCT(n03_004) AS name \
      FROM area_data;" | bin/rails db < /dev/stdin

echo "INSERT INTO municipality_areas (area, municipality_id) \
      SELECT (ST_Dump(geom)).geom AS area, municipalities.id AS municipality_id \
      FROM area_data \
      INNER JOIN municipalities ON name = n03_004;" | bin/rails db < /dev/stdin

echo "DROP TABLE area_data;" | bin/rails db < /dev/stdin
You can see all changes here.
Query and convert municipality data to vector tile
Query relevant data for the map tile.
Vector tiles can be created with a PostGIS query.
First, The geometry data needs to be limited for inclusion into the vector tiles. Only areas that intersect the tile boundary are considered. ST_TileEnvelope is a helper function that generates a polygon for X,Y, and Z. The && is unsed to match intersecting geometries.
  SELECT
    name

  FROM municipalities
    INNER JOIN municipality_areas ON municipality_id = municipalities.id
  WHERE municipality_areas.area && ST_TileEnvelope(:zoom, :x, :y)
Clip area polygons to fit in the tile.
ST_AsMVTGeom preprocesses the geometry data. It clips data outside of the tile polygon.
  SELECT
    name,
    **ST_AsMVTGeom(area, ST_TileEnvelope(:zoom, :x, :y)) AS geom**
  FROM municipalities
    INNER JOIN municipality_areas ON municipality_id = municipalities.id
  WHERE municipality_areas.area && ST_TileEnvelope(:zoom, :x, :y)
The scoped and clipped data is then converted with ST_AsMVTGeom to the Mapbox Vector Tile binary format. The name is added as a vector tile attribute by including it in the select statement.
**SELECT**
**  ST_AsMVT(mvtgeom.*) mvt**
**FROM (**
  SELECT
    name,
    ST_AsMVTGeom(area, ST_TileEnvelope(:zoom, :x, :y)) AS geom
  FROM municipalities
    INNER JOIN municipality_areas ON municipality_id = municipalities.id
  WHERE municipality_areas.area && ST_TileEnvelope(:zoom, :x, :y)
**) mvtgeom**
Let’s integrate the vector tile SQL in Rails.
class MunicipalityArea < ApplicationRecord
  belongs_to :municipality

  def self.for_map_tile(zoom:, x:, y:)
    where('area && ST_TileEnvelope(:zoom, :x, :y)', zoom:, x:, y:)
  end

  def self.as_mvt_geom_for(zoom:, x:, y:)
    sql = sanitize_sql_array([
            "ST_AsMVTGeom(area, ST_TileEnvelope(:zoom, :x, :y)) AS geom",
            zoom:, x:, y:,
          ])

    for_map_tile(zoom:, x:, y:).select(sql)
  end
end
class Municipality < ApplicationRecord
  has_many :municipality_areas

  def self.as_mvt_for(zoom:, x:, y:)
    relation = joins(:municipality_areas)
                 .merge(MunicipalityArea.as_mvt_geom_for(zoom:, x:, y:))
                 .select(:id, :name)

    unscoped.from(relation, :mvtgeom)
      .select('ST_AsMVT(mvtgeom.*) mvt').take.mvt
  end
end
You can see all changes here.
Let’s render the map with Rails
To display a map of the Japanese municipalities, three resources are needed:
1. The vector tile endpoint to stream the binary vector tiles.
The Mapbox Vector Tile specification requires a custom response type, which must be registered with Rails.
# config/initializers/types.rb
Mime::Type.register 'application/vnd.mapbox-vector-tile', :mvt
# config/routes.rb
Rails.application.routes.draw do
  get 'tiles/:zoom/:x/:y', to: 'tiles#show', as: :tile

  ...
end
Now, we can stream the binary Mapbox Vector Tiles with the new MVT format.
class TilesController < ApplicationController
  def show
    zoom, x, y = params.values_at(:zoom, :x, :y).map(&:to_i)

    respond_to do |format|
      format.mvt do
        send_data(Municipality.as_mvt_for(zoom:, x:, y:))
      end
    end
  end
end
2. A Mapbox Style endpoint for the map design.
# config/routes.rb
Rails.application.routes.draw do
  ...
  resource :map_style, only: :show

  ...
end
class MapStylesController < ApplicationController; end
The Mapbox Style Specification is a JSON format that defines the visual appearance of a map. We set the previously created vector tile endpoint as our data source in our example. We are adding two layers to the map. The symbol layer displays the names of the municipalities. The line layer draws the borders of the municipalities.
# app/views/map_styles/show.json.jbuilder

json.version 8

json.center [130.399994, 33.583332] # Fukuoka

json.zoom 12

json.sources do
  json.map do
    json.type 'vector'
    json.tiles [tile_url('{z}', '{x}', '{y}', format: :mvt)]
  end
end

json.layers do
  json.child! do
    json.id 'municipality-label'
    json.type 'symbol'
    json.source 'map'
    json.set! 'source-layer', 'default'
    json.layout do
      json.set! 'text-field', %w[get name]
      json.set! 'symbol-placement', 'line-center'
    end
  end

  json.child! do
    json.id 'municipality-outline'
    json.type 'line'
    json.source 'map'
    json.set! 'source-layer', 'default'
    json.paint do
      json.set! 'line-color', '#3EA5F5'
      json.set! 'line-width', 3
    end
  end
end
3. Render the map on a webpage.
We are displaying the map on the root page of our application.
# config/routes.rb
Rails.application.routes.draw do
  ...

  root 'maps#show'
end
# app/controllers/maps_controller.rb
class MapsController < ApplicationController; end
I have pinned the OpenLayer client with Mapbox support to the Rails application. Without further configuration in JavaScript, we can render the map in an element.
import { Controller } from "@hotwired/stimulus"
import { apply } from "ol-mapbox-style"

export default class extends Controller {
  static values = { url: String }

  connect() {
    apply(this.element, this.urlValue)
      .then((value) => { this.map = value })
  }

  disconnect() {
    this.map.setTarget(null)
    this.map = null
  }
}
We can render the map by pathing the style URL as a data object.
# app/views/maps/show.html.erb

<div class='map'
     data-controller="map"
     data-map-url-value="<%= map_style_url(format: :json) -%>">
</div>
# app/assets/stylesheets/application.css
html,
body {
  margin: 0;
  height: 100%;
}

.map {
  position: absolute;
  top: 0;
  bottom: 0;
  width: 100%;
}
You can see all changes here.
Conclusion
Thank you for making it until the end. I hope you learned something new about geographic applications in Rails. Governments worldwide offer free geographic information, giving you opportunities to create exciting maps.